Python でコンテンツ毎にクリック数,表示回数を合計
Google Search Console より取得したページ.csv を用いて,コンテンツ毎にクリック数と表示回数を合計する Python コードを作成した。本記事では,データの確認から集計処理,可視化までの手順を解説する。
ページ.csv の確認
Google Search Console より取得したページ.csv には,クリック数が多い順に URL,クリック数,表示回数,CTR,掲載順位が記載されている。本記事では,このうち 上位のページ,クリック数,表示回数 を使用する。
URL には 02hari や 09enekan といった識別子が含まれており,これらを用いることでコンテンツ毎の集計が可能である。
例として,以下のようなデータが含まれている。
上位のページ,クリック数,表示回数,CTR,掲載順位
https://masassiah.web.fc2.com/contents/02hari/iz.html,30020,490412,6.12%,5.13
https://masassiah.web.fc2.com/contents/09enekan/index.html,16354,131331,12.45%,8.48
https://masassiah.web.fc2.com/contents/02hari/riron02.html,16098,169841,9.48%,7.55
https://masassiah.web.fc2.com/contents/02hari/riron0102.html,13247,151764,8.73%,5.84
https://masassiah.web.fc2.com/contents/02hari/riron01.html,11603,112553,10.31%,6.77
Python コード
コンテンツ毎にクリック数,表示回数を合計する Python コードを示します。
コンテンツの配列を作成し,URL に含まれる場合にクリック数,表示回数を合計し,配列に格納します。
import pandas as pd

# データの読み込みと前処理
df = pd.read_csv('./csv/ページ.csv', usecols=['上位のページ', 'クリック数', '表示回数'], encoding='utf-8')

contents = [
    '01kouji', '02hari', '03tsuna', '04denken', '05master', '07otsu4', '09enekan',
    '11engin1', '12densek', '13surge', '14plan', '15source', '16isms',
    '17cte', '18ds', '19fe', '20ap', '21st', '22pm', '23sa', '24sm', '25au'
]

clicks = []
impressions = []

# 各コンテンツに対してデータをフィルタリングして集計
for content in contents:
    filtered_sum = df[df['上位のページ'].str.contains(content)].sum()
    clicks.append(filtered_sum['クリック数'])
    impressions.append(filtered_sum['表示回数'])
コンテンツ毎にクリック数,表示回数を合計した結果
コンテンツ毎にクリック数,表示回数を合計した結果について,matplotlib を用いて棒グラフで表示します。
import matplotlib.pyplot as plt
import japanize_matplotlib
def plot_bar(data, title, xlabel, ylabel, filename):
plt.figure(figsize=(14, 6))
plt.bar(contents, data)
plt.xlabel(xlabel)
plt.xticks(rotation=90, fontsize=9)
plt.ylabel(ylabel)
plt.title(title)
plt.tight_layout()
plt.savefig(filename, dpi=300)
plt.show()
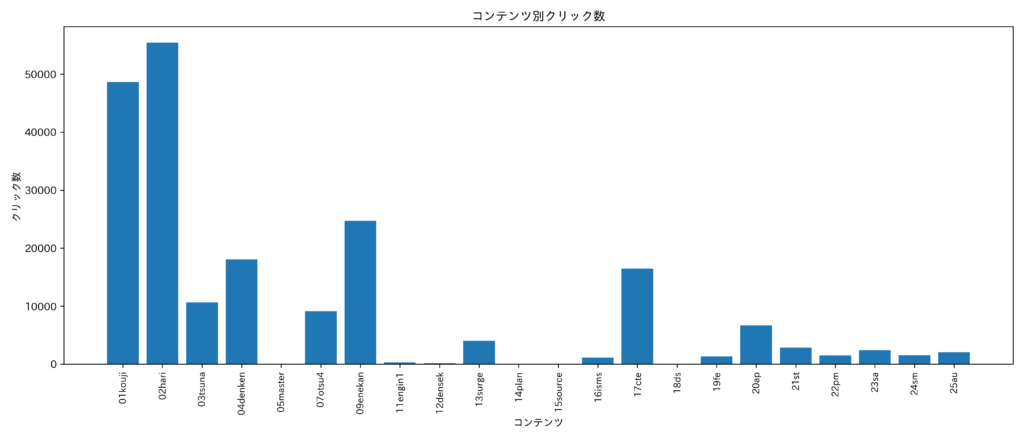
plot_bar(clicks, 'コンテンツ別クリック数', 'コンテンツ', 'クリック数', './images/contents_clicks')
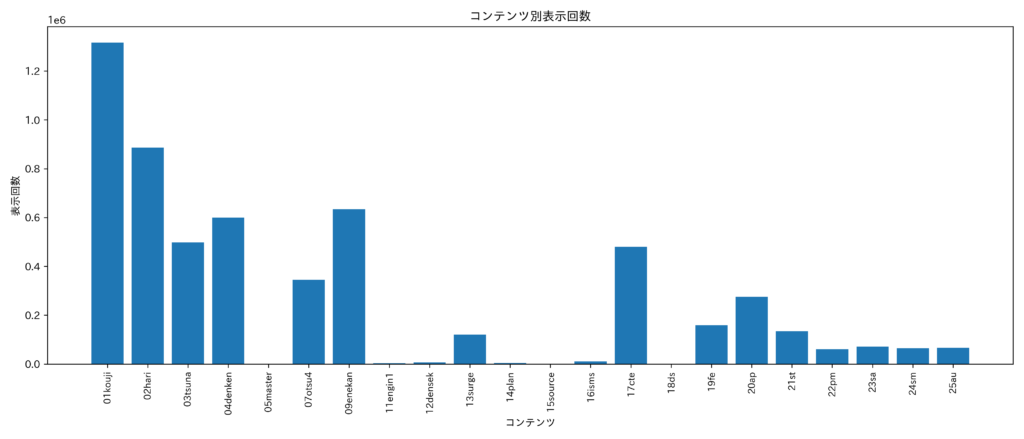
plot_bar(impressions, 'コンテンツ別表示回数', 'コンテンツ', '表示回数', './images/contents_impressions')コンテンツ毎のクリック数合計
コンテンツ毎のクリック数の合計を示す。
クリック数が最も多いコンテンツは「はりのたわみ計算」,次いで「目指せ!第二種電気工事士」となっている。
コンテンツ毎の表示回数合計
コンテンツ毎の表示回数の合計を示す。
表示回数が最も多いのは「目指せ!第二種電気工事士」,次いで「はりのたわみ計算」となっている。
更新履歴
- 2025年1月12日 新規作成
- 2026年1月3日 グラフを更新(横軸のラベルを見やすくした)